Binary options are very simple to understand and use because all it requires is one decision whether the underlying asset will go up or down. Once you choose one of the two options the trade can begin. There are many different binary options strategies available for use, but without a doubt, the 60 seconds binary options strategy is the one who will give you instant gratification. We’re going to use a very simple method that is used by the professional traders to exploit short-term market movements.
Trading shorter time frames, such as the 1-minute TF makes much more sense and is more suitable when trading binary options. However, we have to be aware that on shorter time frames the price action is more volatile and erratic and we need a solid strategy. In these short time periods, it’s more appropriate if we rely on technical analysis and price patterns when making a trading decision.
The 60s Binary Options Strategy
Because there is a higher probability for a financial asset to continue in the direction of the prevailing trend rather than to reverse it we’re going to use a trend following strategy. The 60 seconds binary options strategy is a trend following strategy that uses two technical indicators to determine whether the price of the underlying asset is about to rise or drop. The two indicators that this binary options strategy is based on are the Bollinger Bands and the ADX indicator, which can be found on most binary options trading platforms.
The ADX indicator is a great tool to quantify the strength of the trend while the Bollinger Bands it will help you determine the market volatility. This is a straightforward strategy that will not leave any room for any subjective interpretations.
When to Buy a Call Option
If the underlying asset breaks above the upper Bollinger Bands and the ADX shows a value reading below 15 buy a Call option right at the opening of the next 1-minute candle. It’s important to only purchase a binary option when both of these conditions are met.
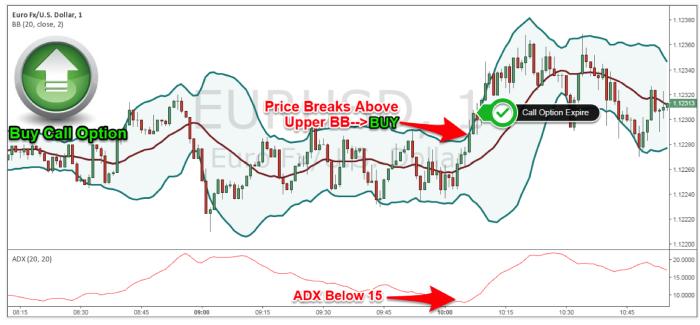
Figure 1: EUR/USD 1-Minute Chart – Call Option Example
In Figure 1 we have the EUR/USD 1-minute chart and buy Call Option trading opportunity is highlighted. We can note that as soon as we broke above the upper Bollinger Bands the market continued in expansion mode, however, we’re only concerned with that first breakout.
When to Buy a Put Option
If the underlying asset breaks below the upper Bollinger Bands and the ADX shows a value reading below 15 buy a Put option right at the opening of the next 1-minute candle.
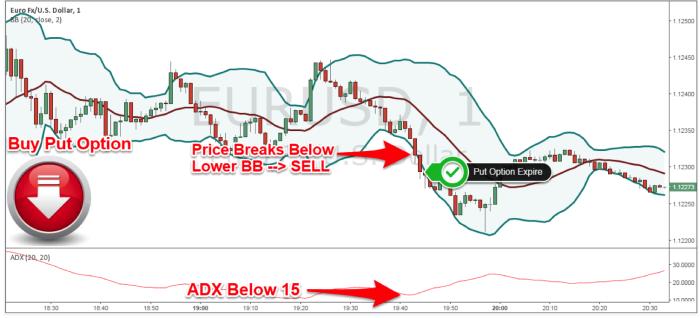
Figure 2: EUR/USD 1-Minute Chart – Put Option Example
The preferred settings for the Bollinger Bands indicator are the default settings. We’re going to use a 20 period for the middle moving average and a two standard deviations for the upper and lower bands. While the ADX indicator uses 20 periods as the preferred settings.
Conclusion
Even though the 60 seconds binary options strategy can generate a buy Call or a buy Put signal every few minutes it’s important to only trade during the most liquid trading hours which are during the London and New York session – the London session and early New York sessions are perfect for South African traders.
The same rules of the 60 seconds trade strategy can be applied to any other asset, be it currencies, stocks, indexes or commodities. Important to not that you should not set high expectations on yourself with this trading strategy, as not every trade will be a winner. Over the long run for sure you’ll end up in profits if you are a disciplined trader and follow the rules.